Profiling
Browse docs
A profiler is shipped by lde, using LuaJIT’s highly performant sampling profiler that can be used in production environments due to its minimal overhead.
lde run --profileThe report shows two things:
- A VM state breakdown: JIT compiled, interpreted, C code, GC, and JIT compiler time.
- This is useful to try and minimize the amount of time spent in interpreted code and in GC.
- A hotspot table with the top 20 functions by sample count.
- Helpful to figure out which functions are taking up the most time.
Flamegraphs
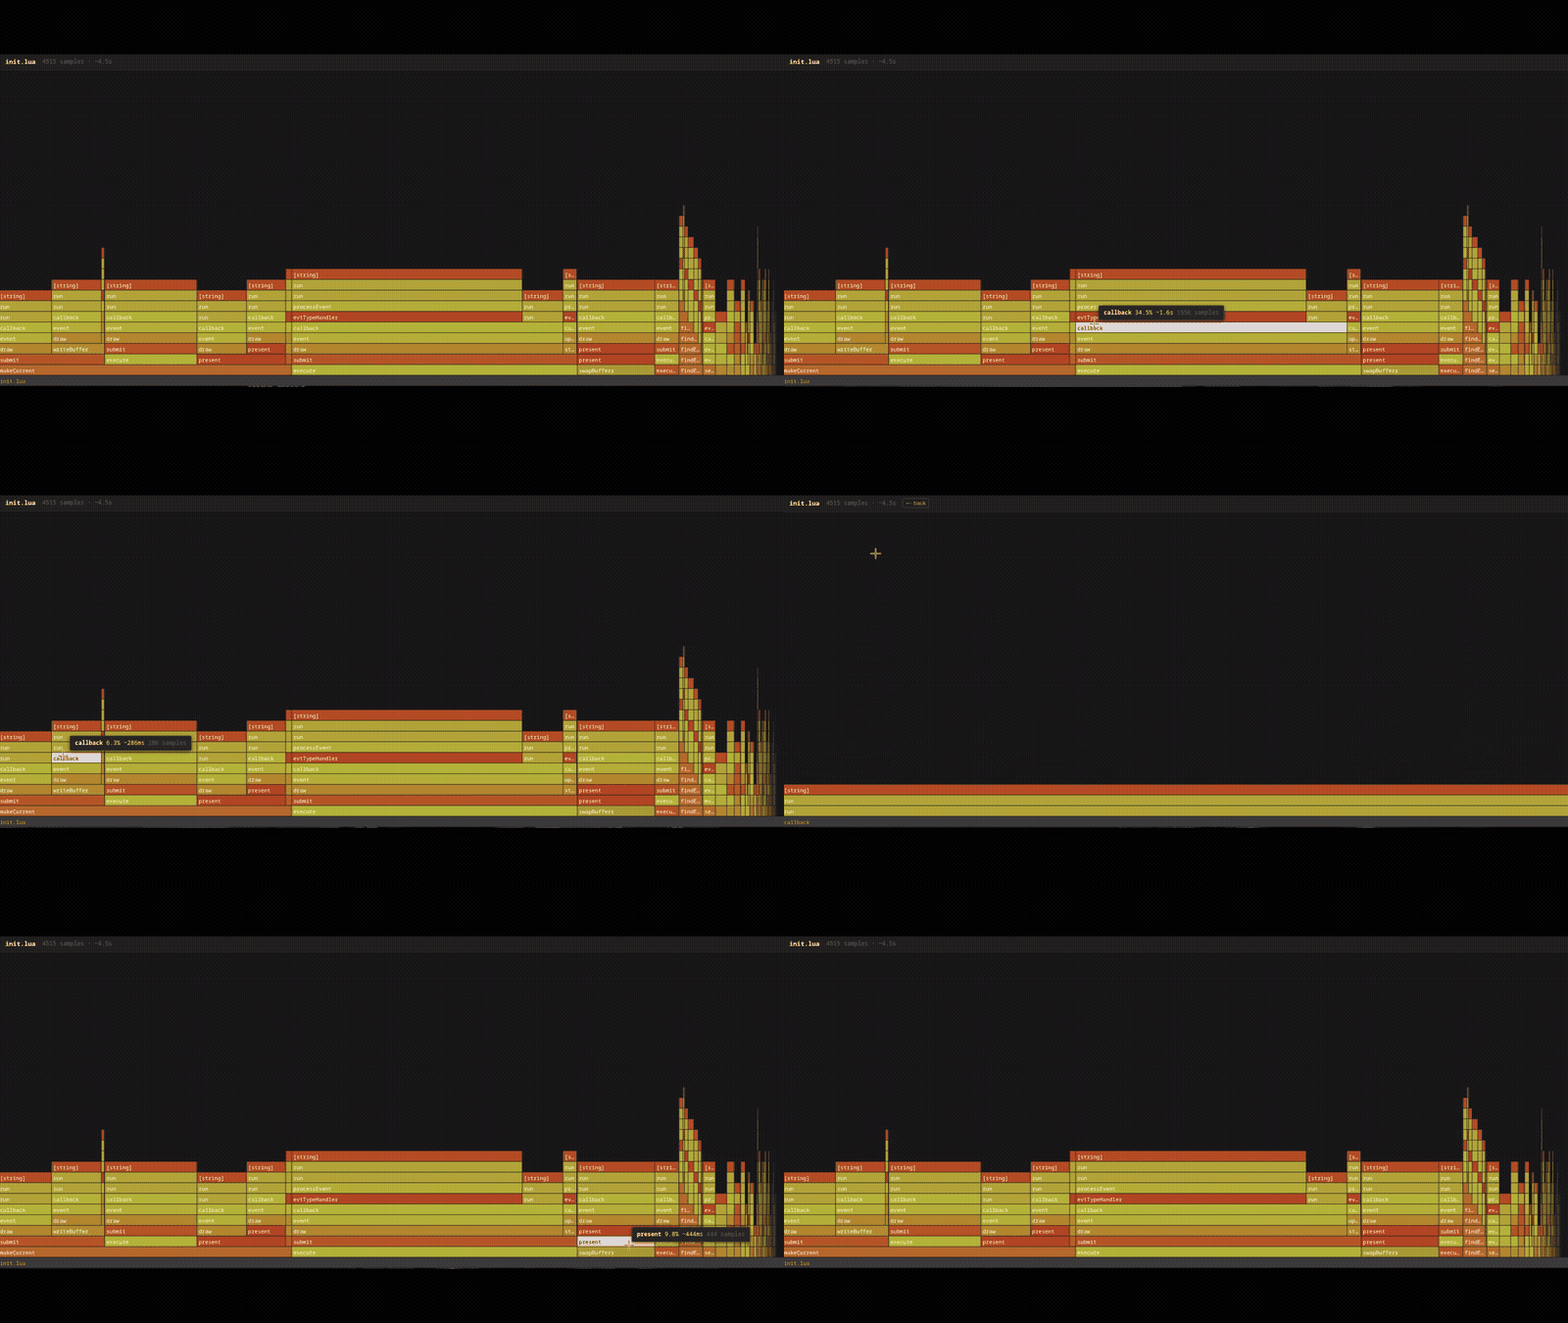
lde run --flamegraph writes an interactive flamegraph:
lde run --flamegraphThis generates a self contained profile.html file. You can open it in any browser, hover over frames, click to expand.
JSON output
lde run --profile --json writes the raw sampled data as JSON. This is useful for historical metrics, or feeding into tooling like llms for analysis.
lde run --profile --json profile.json